Modern Web Development - Part 4

Modern Web Development - Part 4
This is the fourth of ten parts of this blog post. The topics will be:
- 1: A New World
- 2: Architecting JavaScript
- 3: A Better CSS
- 4: Debugging (This Article)
- 5: Joy and Pain of jQuery Plugins
- 6: Packaging Assets
- 7: Distributed Version Control
- 8: Working with Facebook
- 9: Mobile Pages
- 10: Deploying to the Cloud (upcoming)
Debugging
I’ve had Visual Studio open constantly on a laptop for the better part of ten years (and fifteen if you count Visual C++). I am used to setting breakpoints inside of the Visual Studio editor and pressing F5 to see what is happening.
This works in Visual Studio with JavaScript but I’ve only had a good experience doing this with Internet Explorer…and when things go wrong in other browsers, that doesn’t work effectively enough for me.
The other problem with Visual Studio debugging is that code isn’t all I want to debug. I also want to debug CSS and that is just plain nasty in Visual Studio (and don’t tell me to use Expression Web…really). So what’s a web dev to do?
The trick is to use the browser to debug. But which browser? All of them. The fact of the matter is that when you’re doing web development, you’re going to need to test your code with all four major browsers:
- Internet Explorer
- Firefox
- Chrome
- Safari
- Opera (ok, just kidding…)
I don’t test every page as I develop on all four, but once I get testers, I need all four browsers installed for when stuff doesn’t work right on a particular browser.
Getting Prepared for Debugging
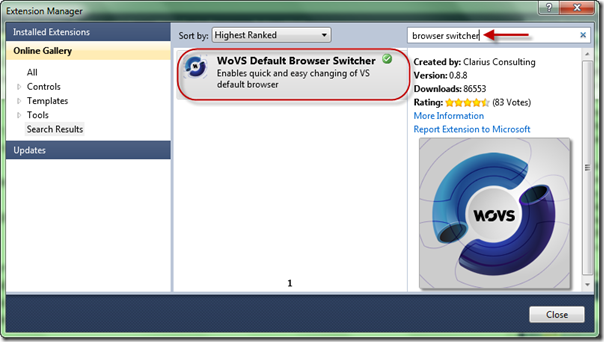
Before you start, I suggest you go and get the Default Browser Switcher in the Extension Manager:
This extension will let you switch the default browser by just clicking on the toolbar:

As you can see above, I have this set to Firefox as I find that to be the easiest of the browsers to debug with. Honestly, most of the browsers are close in functionality now and some people really like the Chrome debugging experience (or even the IE one is passable), but I’ll focus on Firefox.
In Chrome, the tools are built-in but in Firefox I use the tried and true Firebug. To follow along you may need to install it. You can do this in the Add-ons option in the menu in Firefox:

Once you have Firebug installed, it will add a button to the top right of Firefox (or hitting F12 will make it appear):
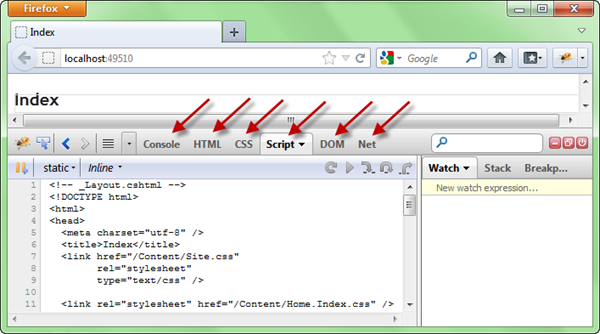
Once you open Firebug, it attaches to the bottom of the browser (though you can move it or open it in a different window). A common approach is to keep it on one monitor and your browser on another if you’re using more than one monitor. I’m not, so it usually looks like this:
The arrows are pointing at the different tabs that will allow you to do different kinds of debugging. Let’s start with JavaScript.
Debugging JavaScript
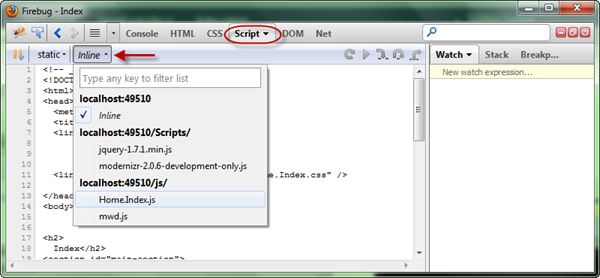
To get started, let’s begin in the Script tab. Once you select the script tag, you can use the dropdown to pick which script to open:
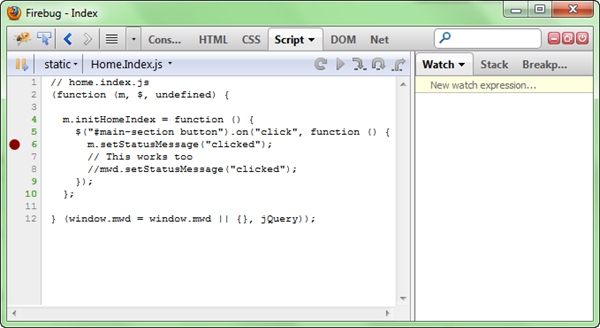
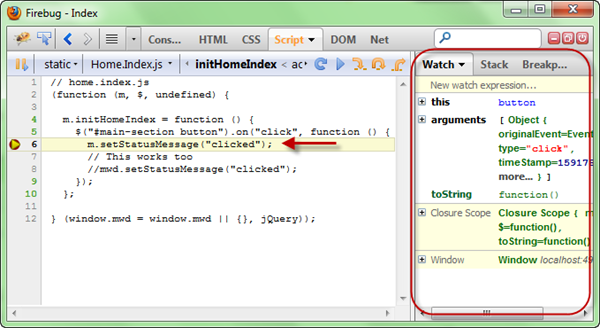
For example, I can pick the Home.Index.js file and use the mouse to click on the line inside the click handler:
This should feel like it does in Visual Studio. At that point you can just click on the button and the breakpoint will stop as expected. You can see the code stop on the right line and even see and set Watches on the right side:
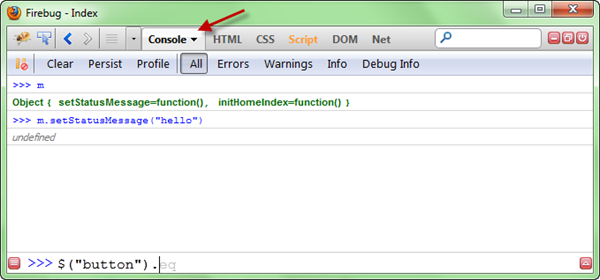
In addition to the Watch, Stack and Breakpoint tabs on the right, you can also go to the Console tab and run any JavaScript command you want (including jQuery if you like):
So you might be wondering, why not just do this in Visual Studio. The cool part is that if you find a problem, change it in Visual Studio and just hit F5 (to refresh the browser) and you’ll test the change. I have found that this workflow makes work really fast (for you VB6 guys, you’re all nodding your head). It’s pretty close to edit and continue ;)
Debugging CSS
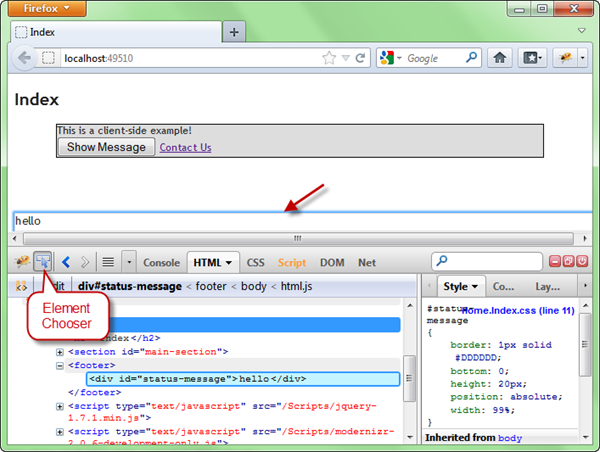
While some people feel like CSS is a black art, using the browser can make this much easier. While in Firebug, go to the HTML tab. You can use the Element Chooser to help with this process (highlighted below):
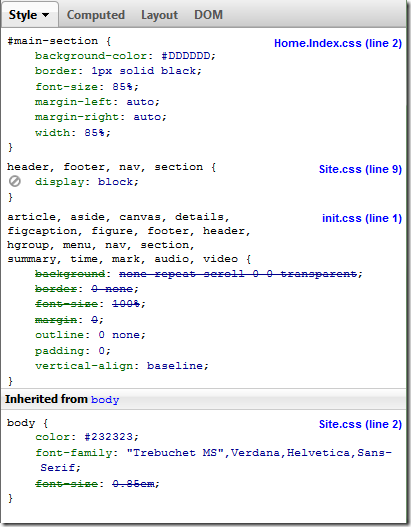
The element chooser let’s you hover over your page and it will select the element in the HTML window for you. That will navigate to the part of the DOM that is under the cursor. This makes is relatively easy to find elements in the DOM. With the element chosen, you can see the style to the right of the window. This will show you not only the properties that the styles set for the element, but it will show you where they came from. For example, if I select the main section, I can see full style inheritance:
Most of the style comes from the #main-section rule in the Home.Index.css file, but then it uses the display property from the section rule in the Site.css, etc. This will show you where the properties are really coming from. When you see that some properties struck out, that means that further cascaded styles have overridden the value.
The really cool thing about this pane is that you can actually just edit the values and see them change in the browser. This means that I can manipulate the style in real-time. This is how I tweak most of my CSS. I change the CSS here and then just copy it into the CSS file when it’s what I want. You can select the values and change them by typing or using the arrow keys to change the values. In addition, you can add new values or disable values as you play with the values. You can see it work here:
Editing CSS in Firebug
Debugging Networking
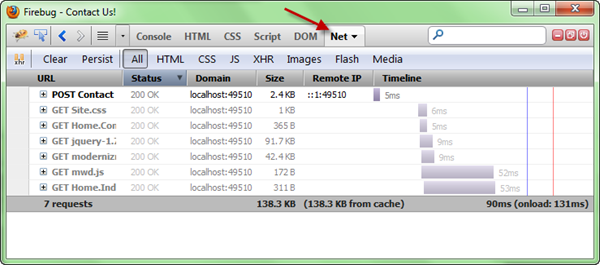
The last common use for Firebug has been to debug what networking is happening in the browser. If you click on the “Net” tab, you can see all the requests (the page, images and network/ajax calls):
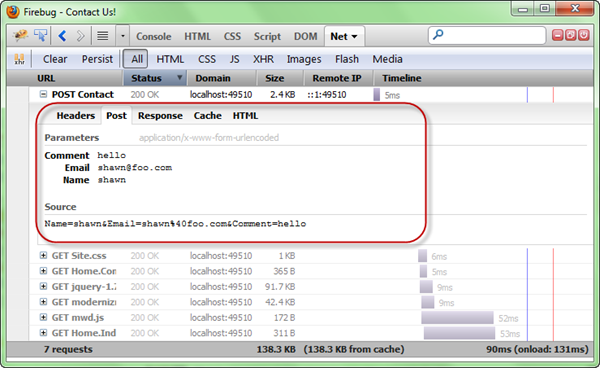
For example, on the Contact page, when I submit the form, I can see the “POST” at the top of the list. Notice the + sign. When you open it you can interrogate the Headers, post, response and cache:
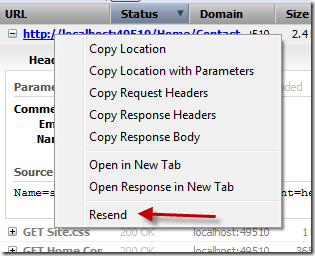
You can even resend the network call if you need to quickly test a scenario (useful if the request requires a lot of steps to achieve):
Remember that since this is just a browser app, you can make changes to the code, recompile and just hit resend to test your code change. This is much easier than breakpoints in Visual Studio in my opinion.
Wrapping It Up
I know for some of you that debugging outside of Visual Studio is going to feel weird and perhaps like cheating, but once you get comfortable with it, you’ll see that the development process is going to be faster and perhaps even more enjoyable!
What do you think?


